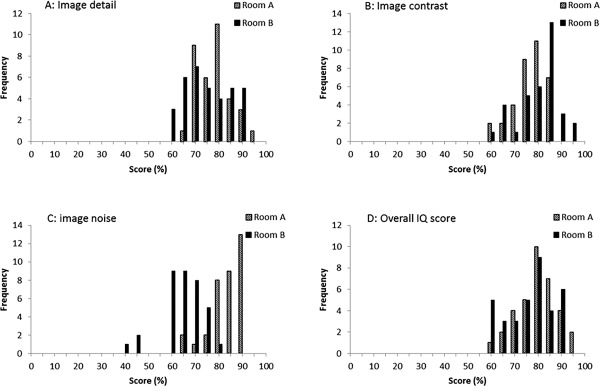
Figure 4.

Distribution of the mean image quality score (%) for the images of the LCA assessment. A: Scores for the first question (image detail) for the reference X‐ray system (Room A) and the new X‐ray system (Room B); B: scores for image contrast; C: scores for image noise; D: overall image quality scores.
