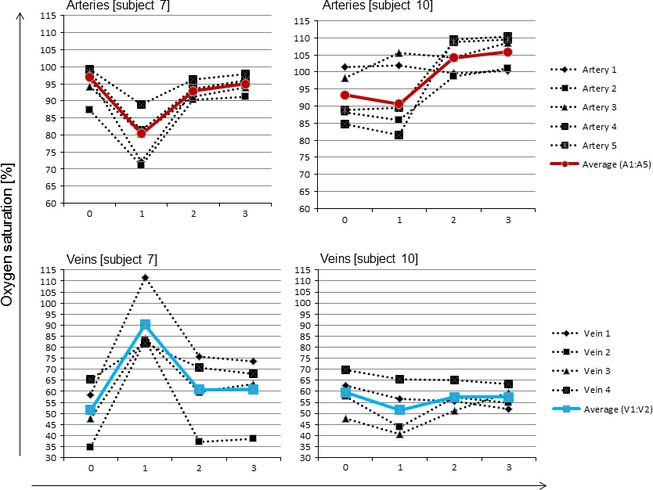
Figure 3.

Example showing single vessel and average annulus arterial and venous oxygen saturation values of two individuals (subject 7 and 10) per condition. X‐axis showing the 4 imaging conditions where: 0 = baseline saturation, 1 = opaque saturation, 2 = yellow 1 saturation and 3 = yellow 2 saturation.
