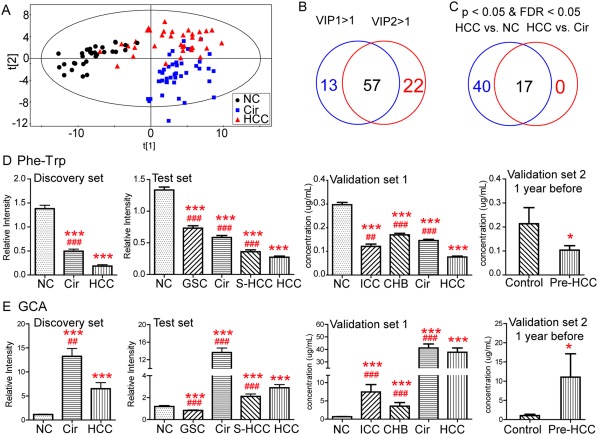
Figure 3.

Identification of potential metabolic biomarkers for the diagnosis of HCC. (A) Partial least squares discriminant analysis score plot based on NC, Cir, and HCC groups in the discovery set. (B) Venn diagram displays variables with VIP values >1 on two principal components (VIP1 and VIP2). (C) Venn diagram displays the differential metabolites when the HCC group was compared with the NC and Cir groups in the discovery set, respectively. Serum relative concentrations of defined potential biomarkers of Phe‐Trp (D) and GCA (E) in the discovery, test, and validation sets, respectively. * P < 0.05, ** P < 0.01, and *** P < 0.001 when compared with NC/controls, respectively; # P < 0.05, ## P < 0.01, and ### P < 0.001 when compared with HCC, respectively. All data are presented as mean ± SE. Abbreviation: FDR, false discovery rate.
