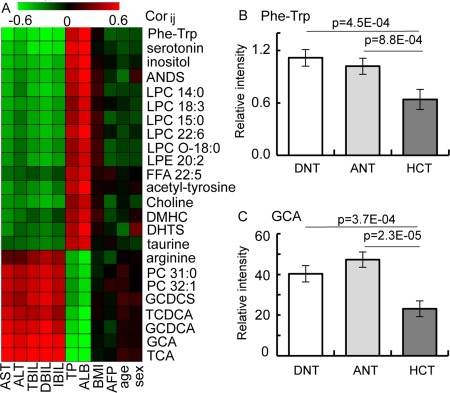
Figure 5.

Understanding the biological relevance of the biomarkers for the HCC diagnosis. (A) Heat map of the Pearson correlation coefficients between differential metabolite contents and clinical parameters. Only metabolites with absolute values of correlation coefficient >0.5 and P values <0.05 were left, and the shades of the color represent the strength of the relationship (red, black, and green represent the positive, no, and negative correlations, respectively). (B,C) Histograms of potential biomarkers in distal noncancerous tissue, adjacent noncancerous tissue, and HCT specimens. All data are presented as mean ± SE. Abbreviations: ALB, albumin; ALT, alanine aminotransferase; ANDS, androsterone sulfate; ANT, adjacent noncancerous tissue; AST, aspartate aminotransferase; BMI, body mass index; DBIL, direct bilirubin; DHTS, dihydrotestosterone sulfate; DMHC, dimethylheptanoylcarnitine; DNT, distal noncancerous tissue; FFA, free fatty acid; GCDCA, glycochenodeoxycholate; GCDCS, glycoursodeoxycholate sulfate; IBIL, indirect bilirubin; LPC, lysophosphatidylcholine; LPE, lysophosphatidylethanolamine; PC, phosphatidylcholine; TBIL, total bilirubin; TCDCA, taurochenodeoxycholate; TCA, taurocholate; TP, total protein.
