
Figure 2.
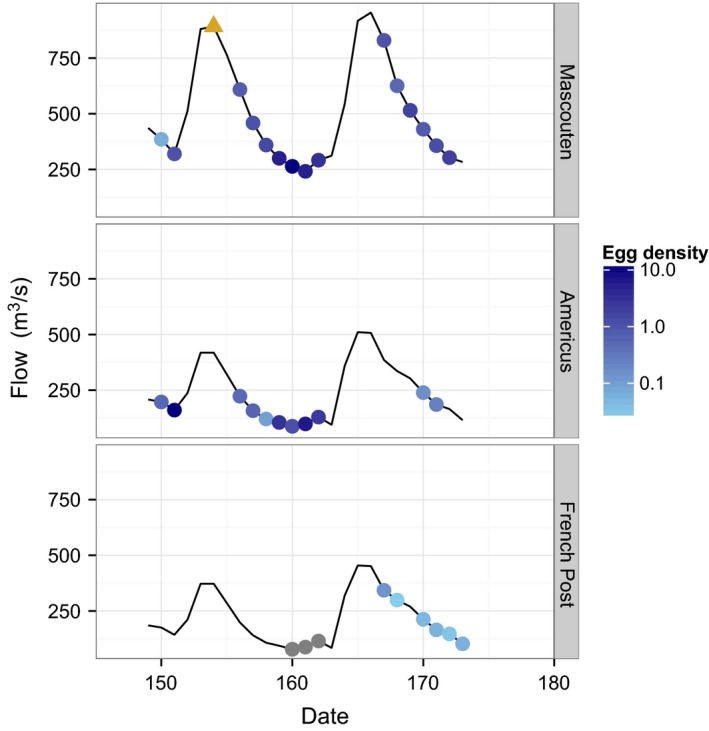
Discharge and egg densities (egg/m3). Discharge is the solid black line and egg densities are represented as shaded circles. The golden triangle is an outlier representing >10 000 eggs/m3 and was plotted separately to allow the other points to be differentiated. Grey points represent egg densities of zero.