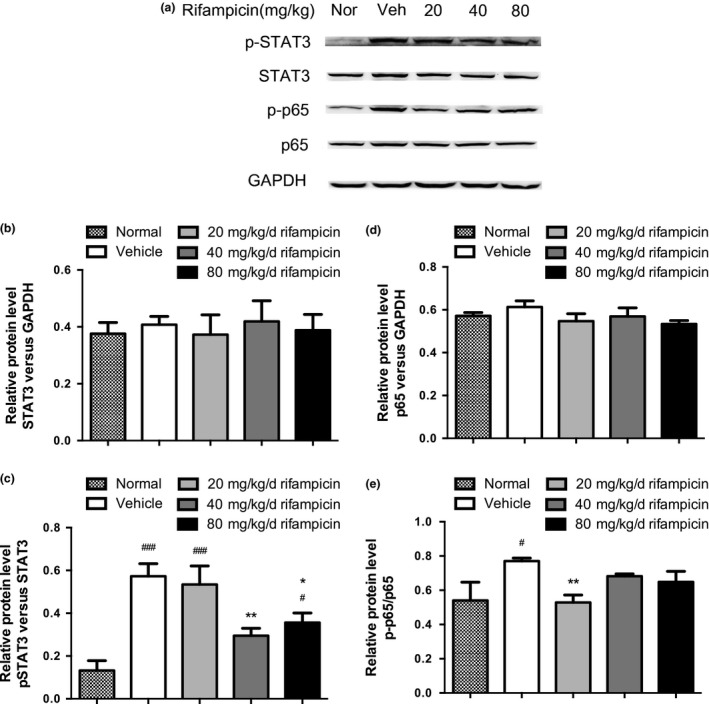
Figure 6.

Expressions of p‐STAT3 and p‐p65 were reduced in rifampicin‐treated experimental autoimmune encephalomyelitis (EAE) mice. Spinal cords were isolated from rifampicin‐treated EAE, vehicle (Veh)‐treated EAE, and normal (Nor) mice on day 26 after immunization (n = 6). (a) Representative bands of STAT3, p‐STAT3, NF‐κB/p65, and p‐p65 by immunoblotting. GAPDH was used as an internal control. (b–e) The histograms represent STAT3, p‐STAT3, p65, and p‐p65 levels expressed as folds relative to the loading control. Statistical analysis was performed using one‐way anova followed by LSD post hoc test to compare replicate by time. Values were shown as mean ± SEM of the independent experiments. Statistical significance: #p < 0.05, compared with normal mice; ###p < 0.001, compared with normal mice; *p < 0.05, compared with vehicle‐treated mice; **p < 0.01, compared with vehicle‐treated mice.
