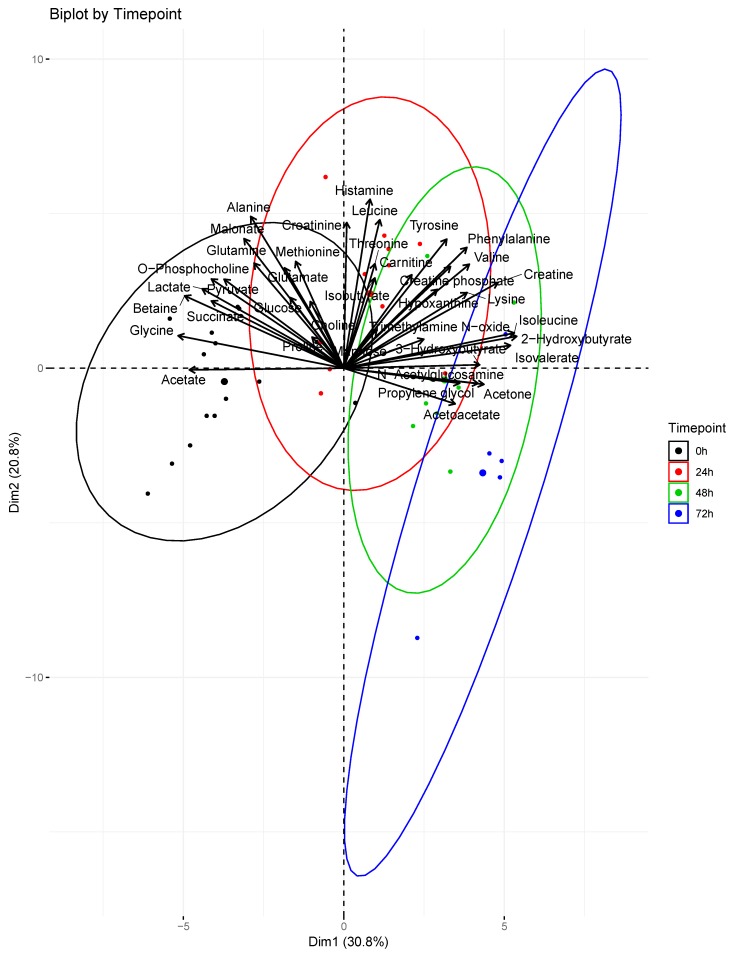
Figure 4.
Principal component analysis biplot. Contributions of profiled metabolites were superimposed over scores for each serum sample. The direction and magnitude of the loadings vectors visually demonstrate how each metabolite contributes to sample clustering by timepoint. The larger dots represent the centroids of the ellipses calculated for each timepoint. At 0 h (n = 15); 24 h (n = 11); 48 h (n = 8); 72 h (n = 5).

