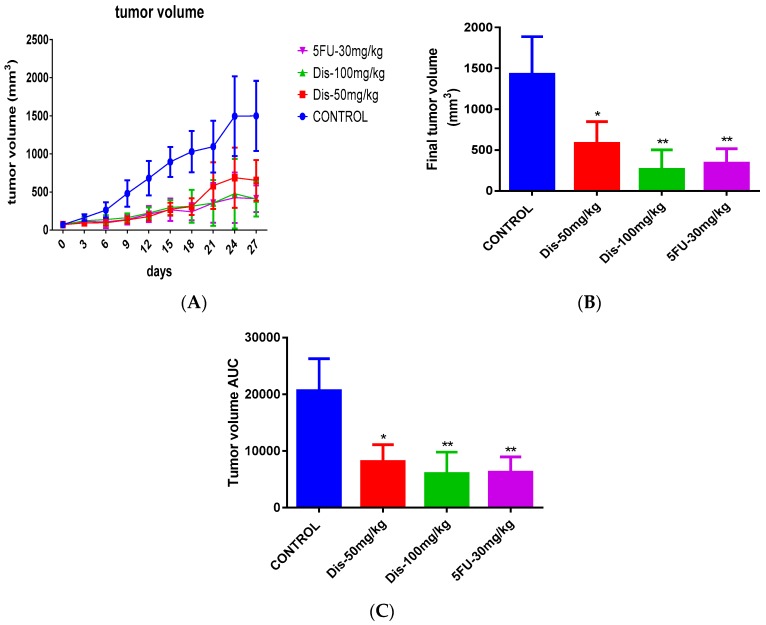
Figure 3.
Tumor volume growth and final tumor volume of treated and untreated mice. (A) Tumor volume growth in control and treated groups during 27 days of treatment. (B) Final tumor volume of treated and untreated groups. (C) Area under the curve (AUC) measurement of the overall changes in tumor volume of treated mice compared to untreated group. Data were expressed as mean ± standard deviation. * p < 0.05, ** p < 0.01 indicate significant differences compared to control.

