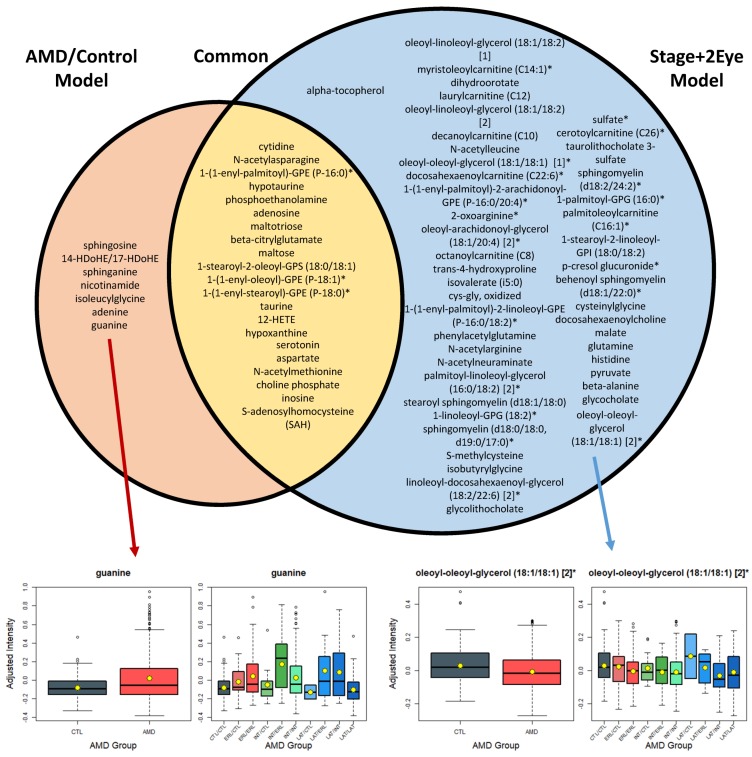
Figure 2.
List of the metabolites differing significantly (q < 0.05) between AMD patients (AMD/Control model), and controls, and across AMD stages of both eyes (Stage + 2Eye model). AMD: age-related macular degeneration; CTL: control; ERL: early AMD; INT: intermediate AMD; LAT: late AMD. Box plots for the most statistically significant metabolites of each analysis are presented. For each box plot, yellow dots represent the mean and black horizontal lines represent the median; AMD/Control model: multivariable logistic regression model considering AMD versus controls as the outcome; Stage + 2Eye: permutation-based cumulative logistic regression model considering both eyes of each patient and the severity stage of disease as the outcome (control, early, intermediate, and late).

