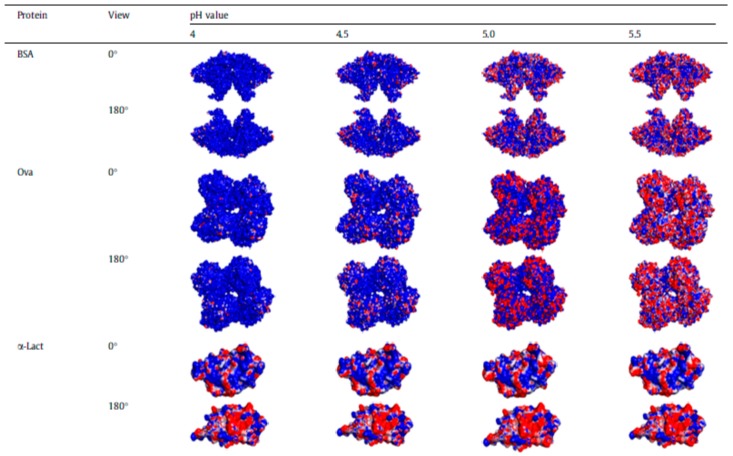
Figure 2.
Simulations of surface charge distribution of bovine serum albumin (BSA), ovalbumin (Ova) and α-Lactoglobulin (α-Lact) at different pH with positively charged surfaces in blue, negatively charged surfaces in red, and neutral in white. Adapted with permission from Ref. [72]. Copyright 2015 Elsevier Ltd. All rights reserved.

