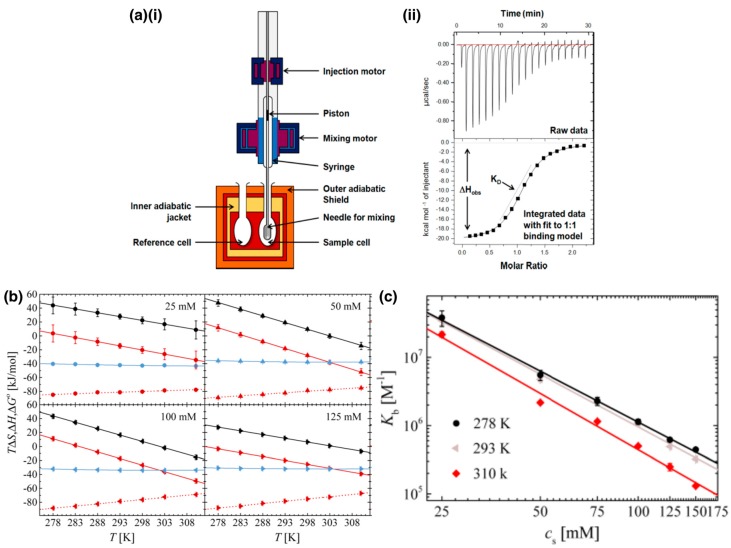
Figure 4.
(a) (i) schematic of an isothermal titration calorimeter and (ii) results and analysis from a representative experiment. One reactant is injected at regular intervals of time into the sample cell holding the other reactant, and the energy required to maintain the sample cell at a constant temperature is measured as shown in (ii). The raw data are integrated and fit to a model to give the binding isotherm from which the binding enthalpy ΔHobs and the binding affinity KD are obtained. Reprinted with permission from Ref. [99]. Copyright 2015, American Chemical Society; (b) entropic (, black) and binding enthalpy (, red) contributions to total free energy (, blue) at different salt concentration, along with the calorimetric enthalpy (, dashed red) for the lysozyme- dendritic polyglycerol sulfate (dPGS) system. has contributions from enthalpy changes due ionization of buffer and of the ligand and changes in conformation; (c) dependence of binding constant (Kb) on salt concentration for the lysozyme-dPGS system. (b) and (c) are adapted and reprinted with permission from Ref. [97]. Copyright 2018, American Chemical Society, respectively.

