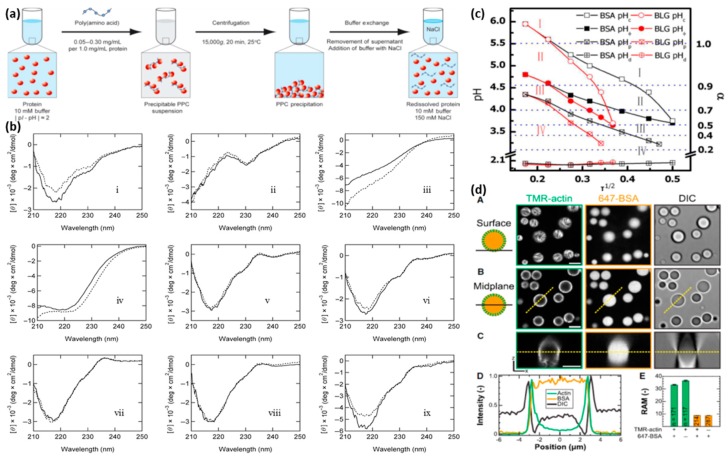
Figure 6.
(a) schematic representation of concentration of proteins by precipitation and redissolution using poly(amino acid); (b) Far-UVCD spectra of i. panitumumab, ii. etanercept , iii. thyroglobulin, iv. L-asparaginase, v. adalimumab, vi. infliximab, vii. rituximab, viii. omalizumab and ix. IgG of native proteins (solid lines) and redissolved proteins (dotted lines) (a) and (b) are reprinted with permission from Ref. [114]. Copyright 2014 Wiley Periodicals, Inc. and the American Pharmacists Association; (c) phase boundaries of BSA and BLG with HA and the degree of ionization HA, α. pHc, pHϕ, pHp and pHd are the pH values of soluble complex, phase transition, precipitation, and redissolution, respectively. Regions I−IV stand for noninteracting, soluble complex, coacervate, and precipitate, respectively. Adapted with permission from Ref. [19]. Copyright 2014, American Chemical Society; (d) (A and B) optical and confocal fluorescence micrographs showing PEC droplets (right) comprising both actin filaments (left) and BSA globules (middle). The focal planes are near the droplets-substrate interface (A) or near the midplane of the droplets (B). (C) An x–z cross section of the droplets evaluated from multiple images obtained at various z values. Scale bar, 5 μm in (A–C); (D) uniform distribution of BSA globules and peripheral enrichment of actin filaments in the PEC droplets as depicted from the normalized fluorescence intensity obtained from line scans along the dashed lines shown in (B) and (C); (E) average ratio of fluorescence intestines inside and outside the droplets, indicating a strong degree of partitioning of proteins in PEC droplets, in samples containing 0.5 mM actin, 0.5 mM BSA, or 0.25 mM actin and 0.25 mM BSA together. Reprinted with permission from Ref. [115]. Copyright 2018 Elsevier Ltd. All rights reserved.

