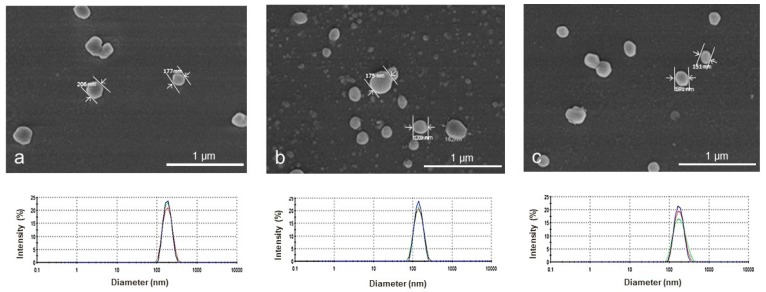
Figure 2.
Representative scanning electron micrograph (SEM) and particle size distribution (DSL) of HEMA/Bayfit-MA NPs. Images obtained from dried (SEM) and aqueous dispersions (DSL) of NP1: (a) NP1 (HEMA/Bayfit-MA 99:1 w/w); (b) NP5 (HEMA/Bayfit-MA 95:5 w/w); and (c) NP10 (HEMA/Bayfit-MA 90:10 w/w).

