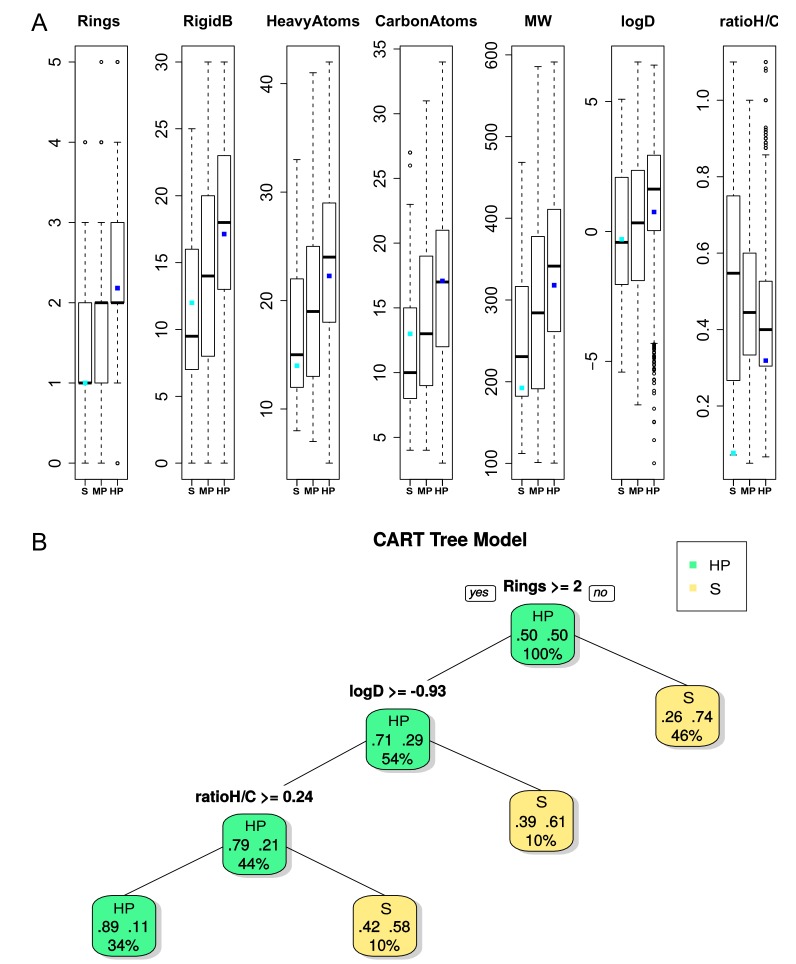
Figure 4.
(A) Boxplot of seven ligand properties (p-value < 3×10⁻¹⁰ except for the ratio between hydrogen and carbon atoms called ratioH/C, p-value = 0.1) from ligands associated with the Ligand–Cluster dedicated to S or HP DBS. For each boxplot, the black bar in the rectangle represents the medium, and the upper side is the third quartile and the lower side is the first quartile of data. The dashed lines represent values below the first quartile limit and values above the third quartile limit. Circles represent atypical values; the cyan dot and the blue dot represent the values of the ligand in interaction with a lyase selective DBS (PDB 4KVI) and an Urokinase HP DBS (PDB 1F5K), respectively, as illustrated in Figure 5. (B) Representation of the CART tree for ligands based on ligand descriptors between S (yellow) and HP (green) ligands. Each node is described by the class (promiscuity), the probability per class (right = HP and left = S), and the percentage of observations in the node. The CART model provided an average accuracy, sensitivity, and specificity of 77%, 67%, and 77% for the test set (53 versus 2,621 ligands), respectively, and 72% ±3%, 69% ±7%, and 73% ±3% while using a five-fold cross validation on the training set (500 runs), respectively.

