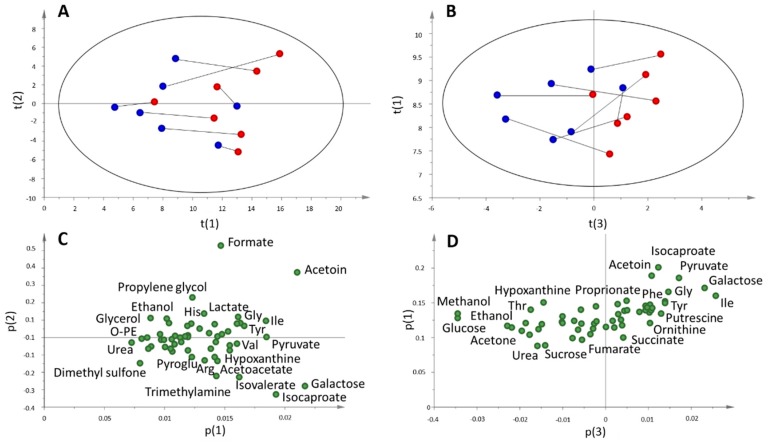
Figure 5.
(A) Score plot and (C) loading plot for the PCA analysis of pre (blue) and post-samples (red) of the game group (n = 7) using TPWS normalization. The lines connect samples belonging to the same subject (B) Score plot and (D) loading plot for the PCA analysis of pre (blue) and post-samples (red) of the game group (n = 7) using TOMC-normalized data. Abbreviations: Arg, arginine, Gly, glycine, His, Histidine, Ile, isoleucine, O-PE, o-phosphoethanolamine, Phe, phenylalanine, Thr, threonine, Tyr, tyrosine, Val, valine.

