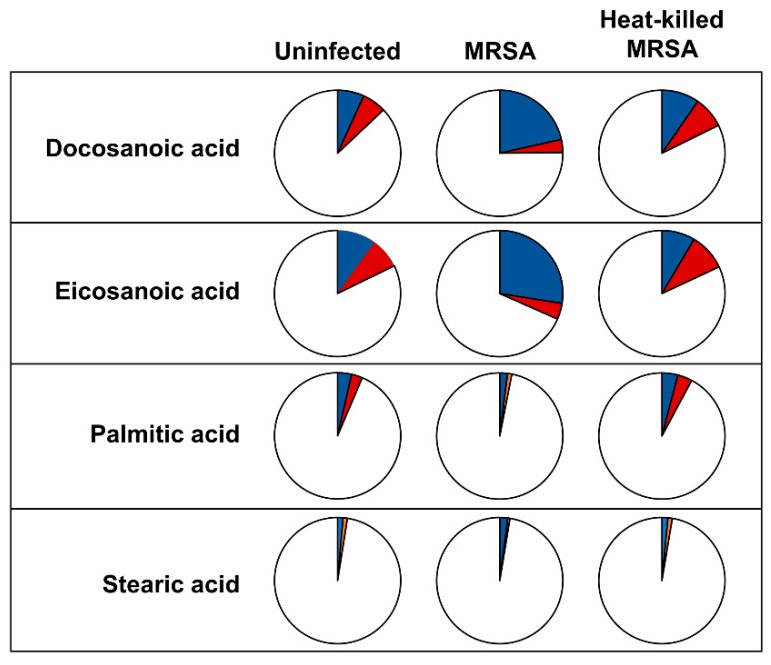
Figure 2.
Labelling distribution of lipid-bound docosanoic, eicosanoic and palmitic acid is altered after intracellular USA300 infection. HeLa cells were infected with USA300 and exposed to heat-killed USA300 (MOI 100; 6 h) and labelling distribution was detected by GC-MS. Pie charts display the labelling pattern of transesterified fatty acids from uninfected cells (left pie-chart), cells infected with USA300 strain (middle pie-chart) and cells exposed to heat-killed USA300 (right pie-chart). Within pie-charts, blue slides represent carbon coming from labelled glucose, whereas red slides are carbon coming from labelled glutamine and white slides show carbon from other sources.

