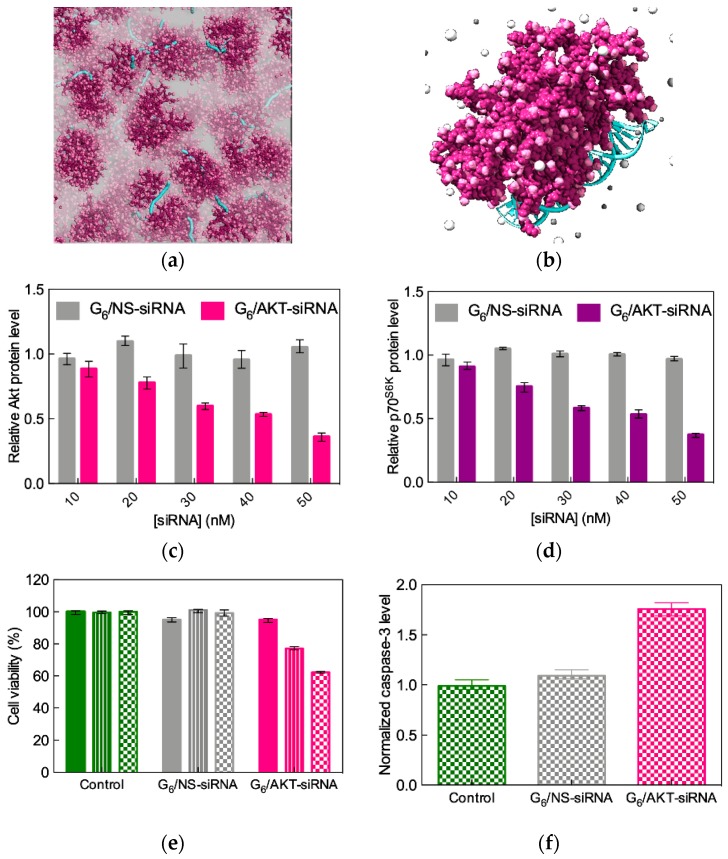
Figure 8.
(a) Simulation of G6 TEA-core PAMAM dendrimers in complex with AKT siRNA at N/P = 5. The dendrimers are portrayed as wine-colored spheres, with charged amine groups depicted in pink. siRNA molecules are shown as turquoise sticks. A transparent gray field is used to represent the solvent environment. (b) Zoomed view of one single G6 TEA-core PAMAM molecule in complex with one AKT siRNA (colors as in panel a). Some Cl- and Na+ counterions are shown as white and light gray spheres, respectively; water molecules are not shown for clarity. siRNA concentration-dependent inhibition of AKT (c) and its downstream effector p706SK (d) in SKOV-3 cells three days after TEA-core G6-mediated delivery (N/P = 5). Data for non-specific (NS) siRNA–G6 complexes are shown for comparison. Protein expression levels were determined by western blotting, quantified by densitometry, and are expressed as fold-change normalized to β-actin. (e) Time-dependent growth inhibition of SKOV-3 cells transfected with G6 TEA-core PAMAM dendrimers (N/P = 5) and with non-specific (NS) siRNA–G6 complexes, as determined by the MTT assay. Values are expressed as % relative to control (non-treated cells). Filled bars: 24 h post transfection (p.t.), striped bars: 48 p.t., checked bars: 72 h p.t. (f) Caspase-3 activation in SKOV-3 cells determined 72 p.t. with G6 TEA-core PAMAM dendrimers at N/P = 5. Data for non-specific (NS) siRNA–G6 complexes are shown for comparison. Values are expressed as fold change normalized to β-actin used as control. Adapted from [47], which is an open access article published under an ACS AuthorChoice License.

