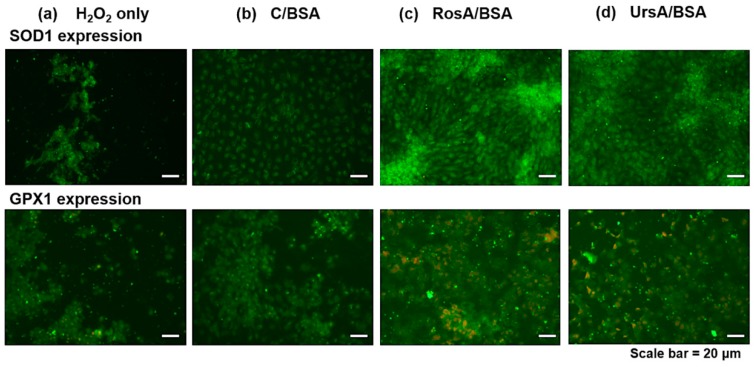
Figure 9.
The results of immunofluorescent imaging examination of SOD1 and GPX1 protein expression in the ARPE cells. First, the cells were incubated with drug formulations (b: C/BSA, c: RosA/BSA, and d: UrsA/BSA) at 50 μM and then H2O2. The cells were incubated with antibodies to detect each antioxidant protein type. The images of cells treated with (a) H2O2 only are also displayed with the scale bar 20 μm.

