
Figure 5.
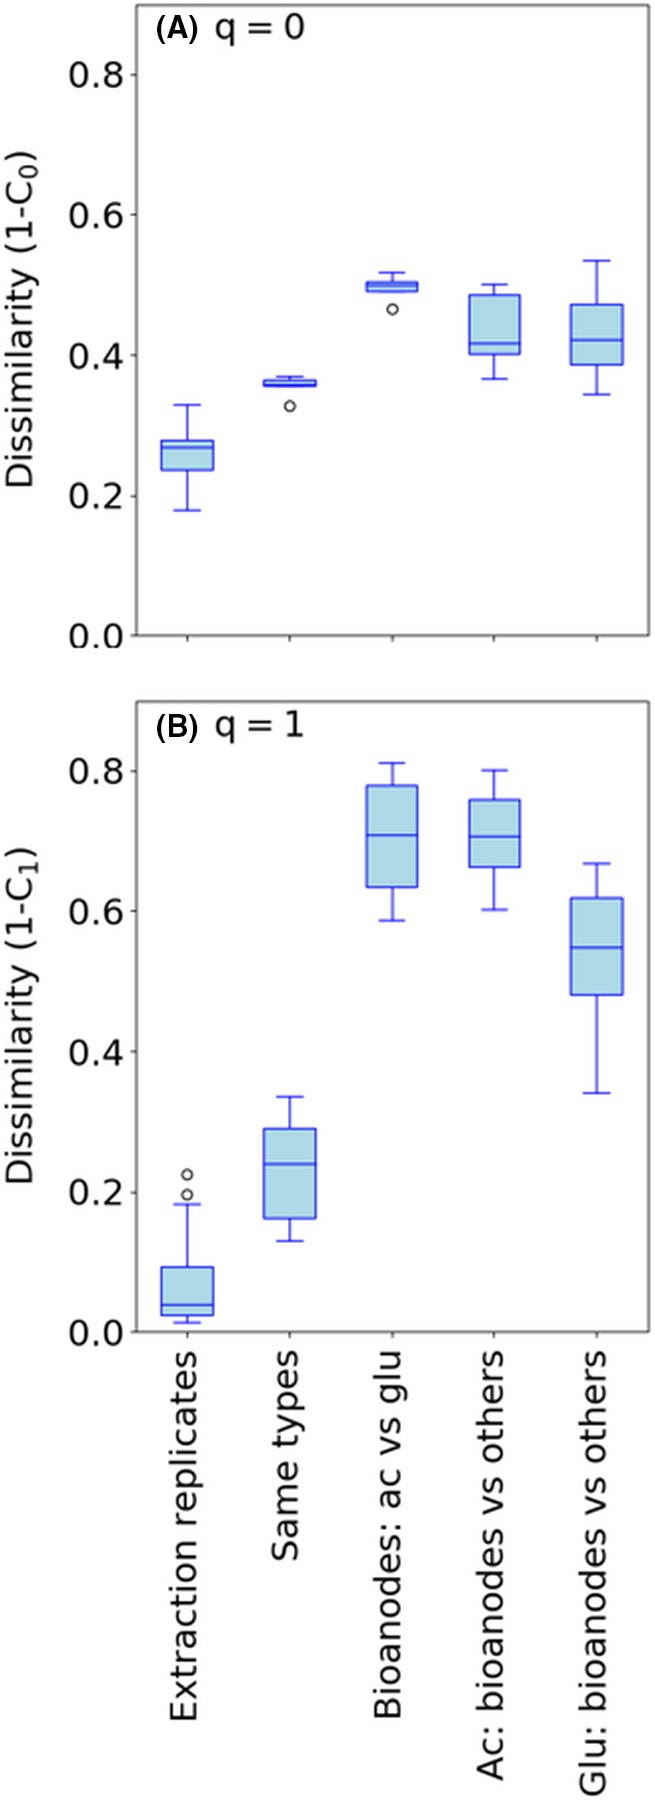
Dissimilarity values for different categories of samples calculated using (A) 1‐C0 (presence/absence data) or (B) 1‐C1 (the relative abundance of sequence variants is taken into account). Same types refer to samples of the same type (e.g. bioanodes), fed with the same electron donor (e.g. acetate), but collected from different MFCs (e.g. MFC0 and MFC2). Ac refers to acetate, and glu refers to glucose.