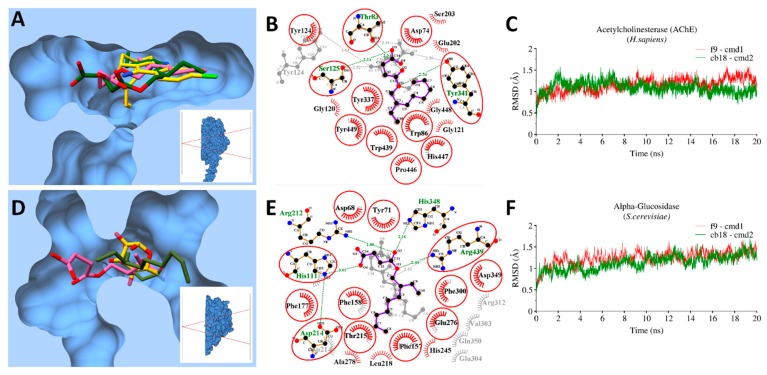
Figure 4.
Molecular interactions and MD simulations of CB18 and F9 against AChE and S. cerevisiae-α-glucosidase. (A) The molecular surface representation of acetylcholinesterase (AChE) with bound co-crystalized ligand (gold), CB18 (green) and F9 (pink) superimposed together; (B) 2D-interaction plots with AChE after MD-simulations, hydrophobic interacting residues are labeled black with spiked red arc, while those interacting through H-bonds are labelled green with distance in angstrom. Conserved residues are marked with red circles; (C) RMSD trajectory plots of AChE with bound CB18 (green) and F9 (red) over a period of 20 ns. The same representation of corresponding S. cerevisiae-α-glucosidase with bound CB18 and F9 are displayed in (D–F) respectively in the same color schemes.

