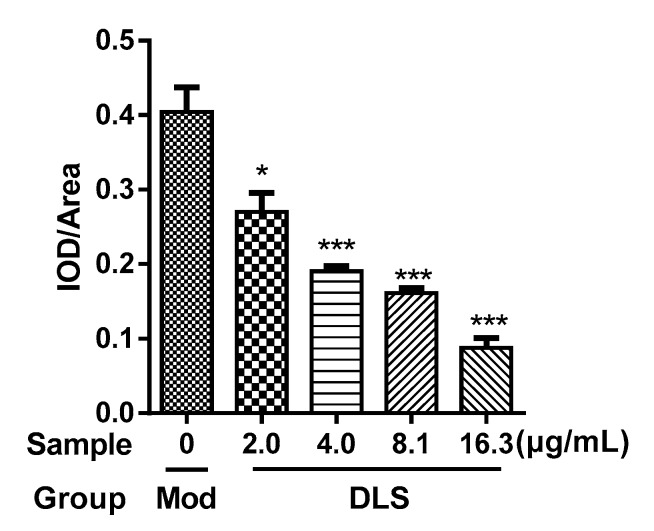
Figure 2.
Gray value (integrated optical density (IOD)/Area) of 3T3-L1 cells stained by Oil Red O. Mod group: fully differentiated 3T3-L1 cells; Dendrobium loddigesii (DLS) groups: fully differentiated 3T3-L1 cells treated with DLS at 2.03, 4.06, 8.12, and 16.25 μg/mL, respectively; data were mean ± SD; * p < 0.05 and *** p < 0.001 vs. Mod.

