Figure 13.

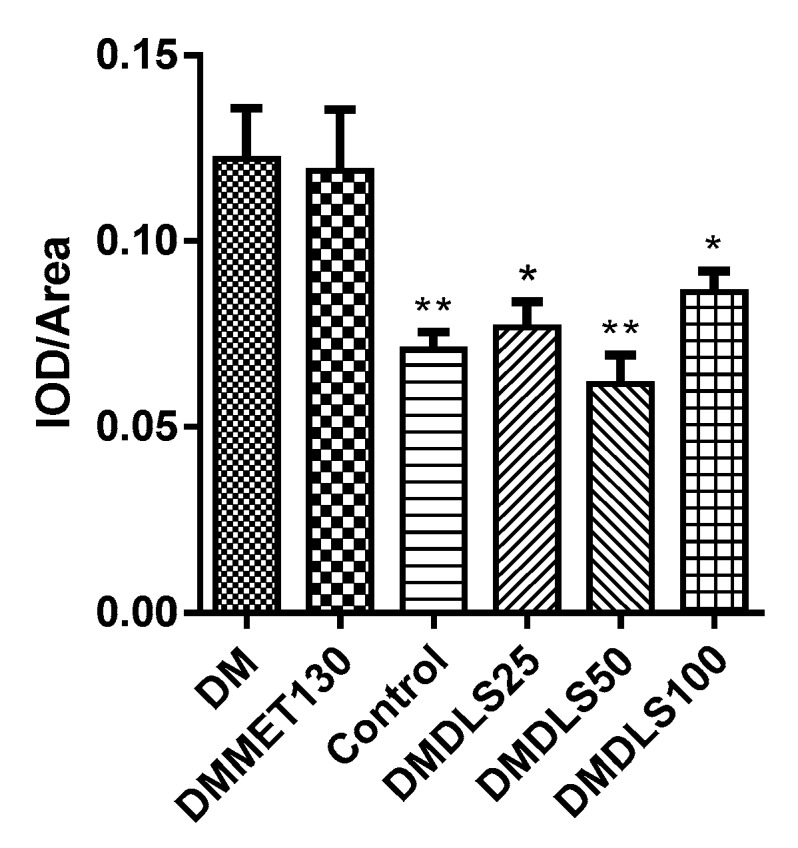
Gray value (IOD/Area) of immunohistochemistry sections of the cleaved caspase-3. Data are means ± SD (n = 8–10); * p < 0.05 and ** p < 0.01 vs. no-treatment diabetes mellitus (DM) group; IOD: integrated optical density.

Gray value (IOD/Area) of immunohistochemistry sections of the cleaved caspase-3. Data are means ± SD (n = 8–10); * p < 0.05 and ** p < 0.01 vs. no-treatment diabetes mellitus (DM) group; IOD: integrated optical density.