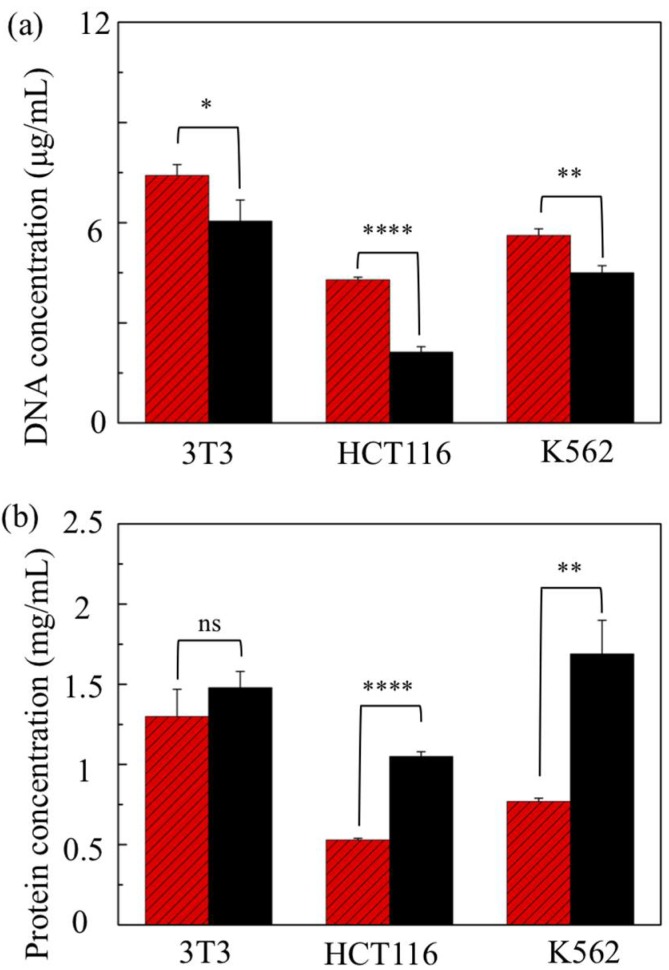
Figure 4.
(a) DNA and (b) protein levels in the lysates of three distinct cell lines obtained through an eight-constriction treatment (light-shaded columns) and a chemical treatment (dark-shaded columns). The constrictions are μm and μm. The population density is 2.5 × 10⁶ cells/mL. (ns: not significant; ; ; ; two-tailed t-test). Error bars: ±1 SD ().

