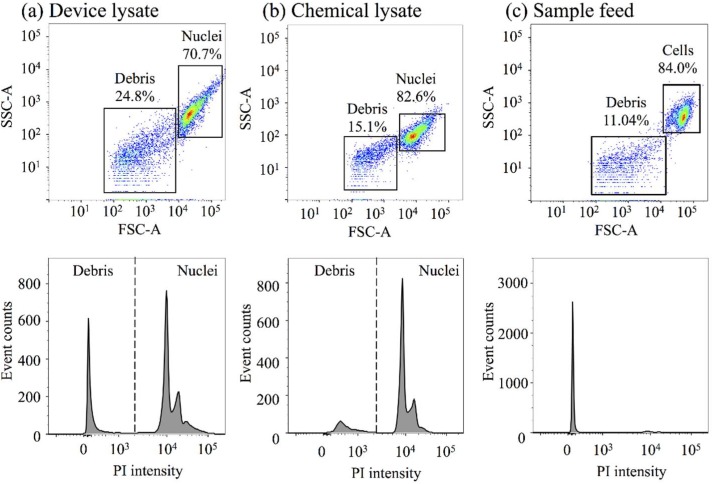
Figure 5.
Representative scatter plots of forward-scattered (FSC) and side-scattered (SSC) data and the corresponding histograms of propidium iodide (PI) intensity from (a) a device lysate (from a four-constriction treatment) and (b) a chemical lysate, as well as (c) the sample feed (untreated cells). The constrictions are μm and μm.

