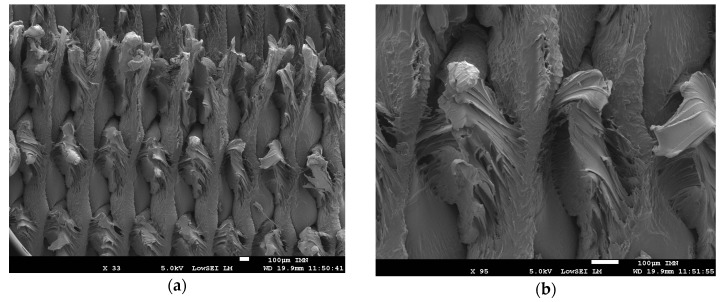
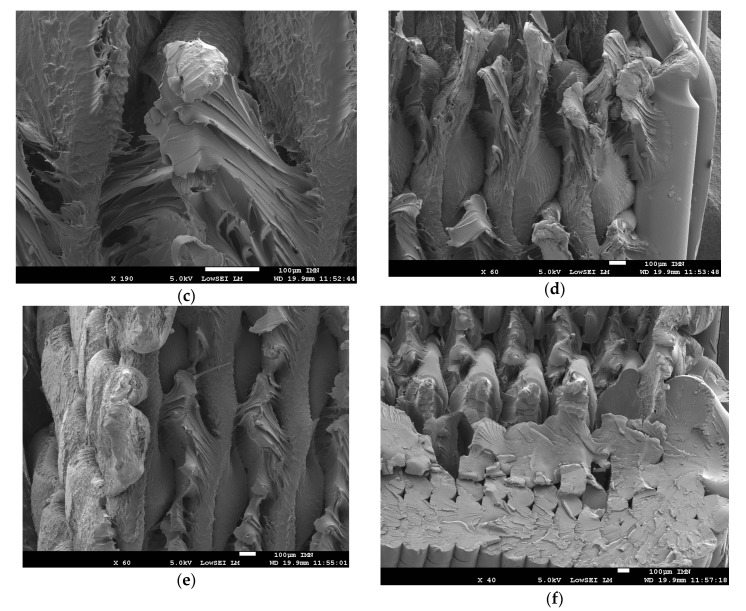
Figure 8.
Analysis of the microstructural arrangement near the fractured zones in printed PETG using a scanning electron microscope. The printing temperature is 240 °C. (a) gaps between adjacent filaments, (b) stretched filaments, (c) zoomed view on inhomogeneous filament stretching, (d) localised deformation, (e) zoom-in on localisation in deformed raster, (f) brittle fractured external frame.


