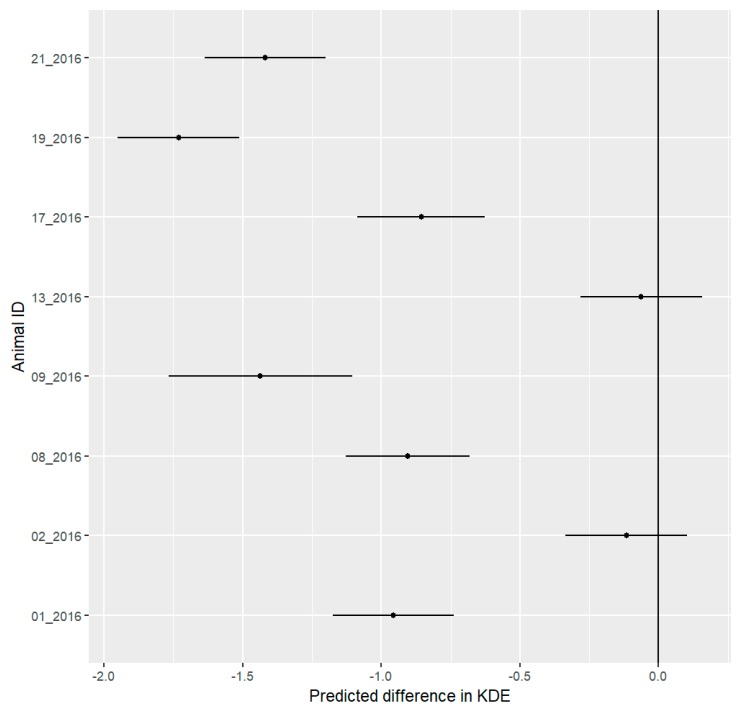
Figure 1.
Mean predicted differences with 95% confidence interval for differences in daily Kernel density estimation 50% (50KDE) areas of eight hedgehogs between the pre-festival and festival phases. The predicted difference represents changes in hectares. We consider all differences to be significant where the confidence interval does not include 0. Six out of eight hedgehogs show a significant decrease in KDE50.

