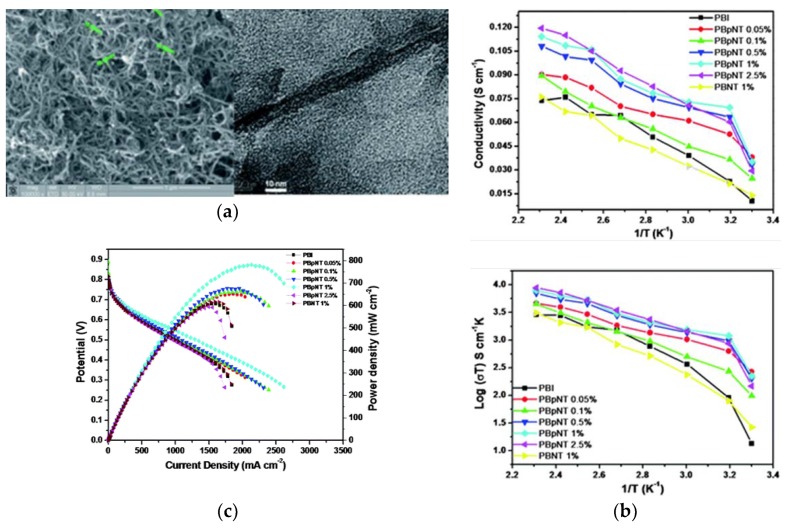
Figure 15.
SEM image of p-MWCNTs and TEM image showing the distribution of p-MWCNTs inside the PBI matrix (a); proton conductivity and Arrhenius plots of the different composite membranes and pristine PBI (b); fuel cell polarization curves measured by supplying dry H2/O2 with a flow rate of 0.2 standard liter per minute (slpm) at 140 °C (c). Reprinted with permission from Ref. [132]. Copyright 2011 Royal Society of Chemistry.

