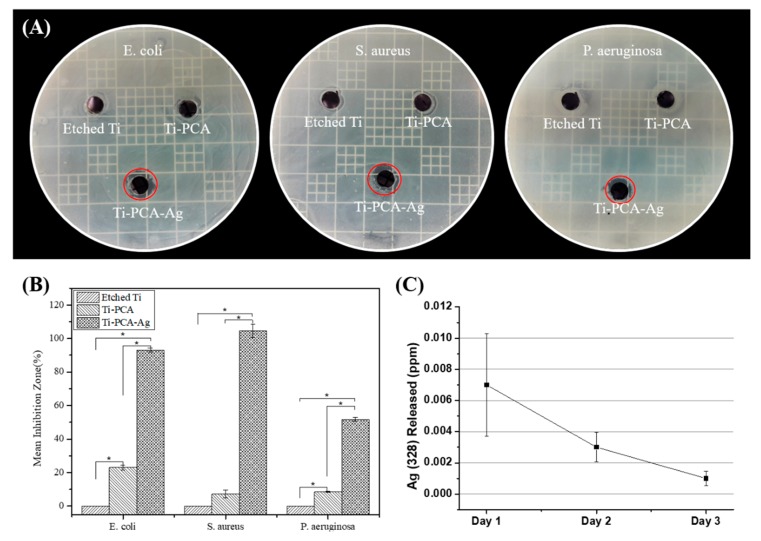
Figure 5.
Representative images of antibacterial activities using (A) E. coli (left), S. aureus (middle), and P. aeruginosa (right) after 24 h after adhered specimens. (B) Graph of inhibition zone measured by Image J software (n = 3 and * indicates statistical significance (p < 0.05) measured by one way ANOVA Tukey test). (C) Ag 328 elution from the Ti–PCA–Ag detected via inductively coupled plasma atomic emission spectroscopy (ICP-OES) (n = 3).

