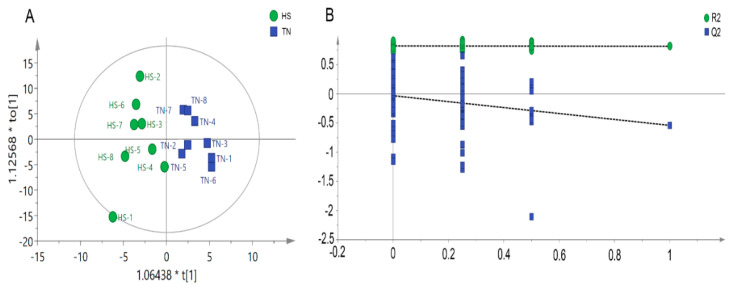
Figure 3.
Score plot of orthogonal projections to latent structures discriminant analyses (OPLS-DA) derived from the GC-MS profiles of serum samples obtained from the heat stress (HS) group vs. thermal neutral (TN) group (A); Validation plots of the partial least squares discriminant analysis (OPLS-DA) models acquired through 999 permutation tests for the GC-MS data of serum metabolome (B).

