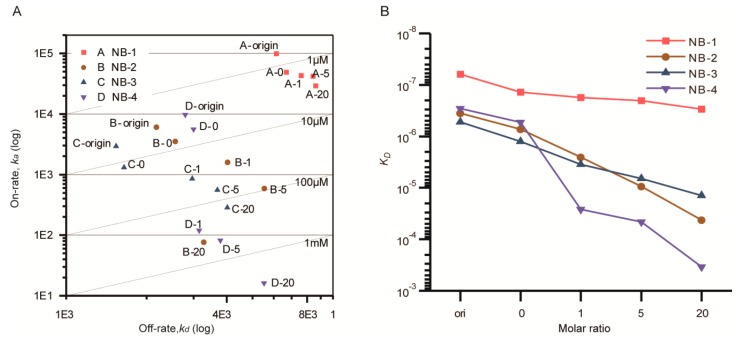
Figure 4.
On-Off rate map (A) and affinity variation (B) of the modified VHH measured by Biacore T200. (A) Double logarithm coordinate was used; the diagonal line was equal affinity line (KD). (B) Single logarithm coordinate was used to show the affinity variation directly. Different VHHs were distinguished by colors. Five samples were measured for each VHH. The point “origin” represented VHHs without any treatment, the point “0” was rated as negative control, the points “1, 5, 20” represented VHHs modified with given molar ratio of NHS-Fluo. The ka of NB-4 modified by a 20 fold amount of NHS-Fluo was outside the limits that can be accurately measured by the Biacore T200 system.

