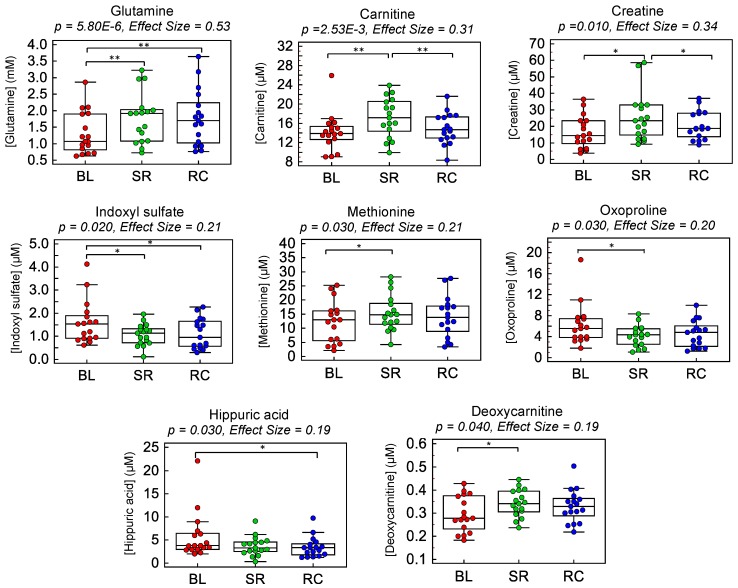
Figure 3.
Box-whisker plots illustrating dynamic changes among eight top-ranked plasma metabolites modulated after two weeks of step reduction (SR) with a subsequent two week recovery (RC) period to normal physical activity as compared to baseline (BL) in a cohort of older pre-diabetic adults (n = 17). A repeated measures one-way ANOVA test was performed to identify significant changes in circulating metabolite concentrations as summarized in Table 2, where a bracket represents a significant pairwise comparison (* p < 0.05; ** q < 0.05). Overall, these plasma metabolites reflect adaptive metabolic responses to physical inactivity/muscle disuse from step reduction that did not fully recover after resuming normal habitual physical activity.

