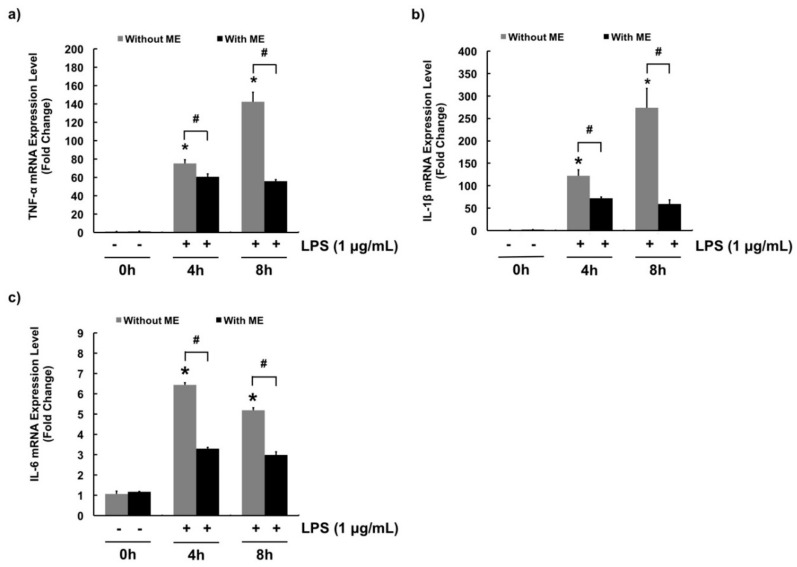
Figure 4.
mRNA expression levels of pro-inflammatory cytokines in cells treated with moringa extract (ME). Gene expression levels of pro-inflammatory cytokines (a) TNF-α, (b) IL-1β, and (c) IL-6 were determined. Cells were pre-treated with or without ME (200 µg/mL) for 12 h followed by LPS treatment (1 µg/mL) for 0, 4, and 8 h. mRNA expression levels were measured using RT-PCR. mRNA expression levels were calculated relative to GAPDH expression. Values represent means ± SEM (n = 3). *, significant difference vs. control (no ME, no LPS) (p < 0.05). #, significant difference between the two treatment groups (p < 0.05).

