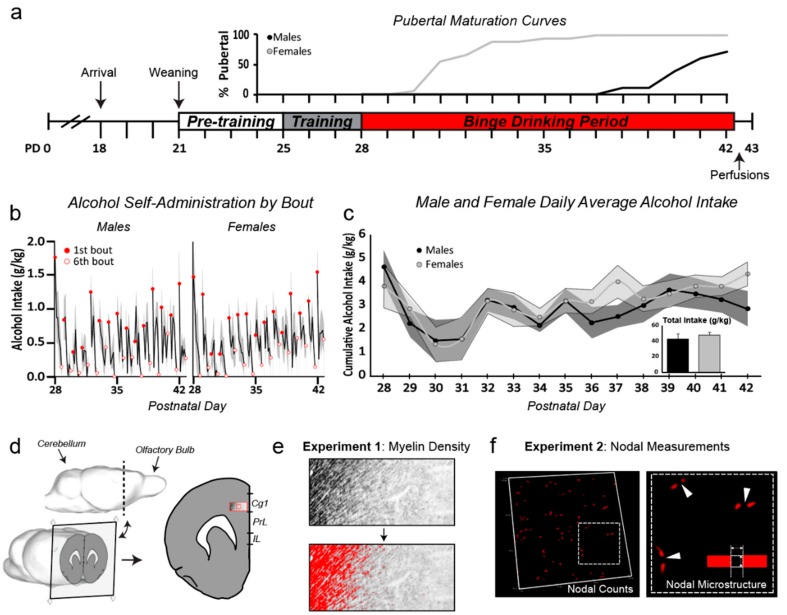
Figure 1.
Overview of experimental design, pubertal maturation, and alcohol self-administration. (a) Timeline of operant self-administration and pubertal maturation curves (indexed by external signs of pubertal onset). Females were in a pre-pubertal state for a few days to one week after alcohol exposure began, whereas males were pre-pubertal for most of the two-week exposure period (sex difference in pubertal maturation, p < 0.0001; no effect of treatment, p > 0.05). (b) Alcohol intake (g/kg) within each self-administration bout. Animals had access to sweetened solution (alcohol or water) for 30 minutes for each bout, followed by 60-minute breaks where the lever was retracted (6 bouts/day for two weeks). Both males and females showed evidence of ‘front-loading’ within an overnight session, drinking significantly more during the first bout of each day when compared to the last bout (p < 0.01 for both males and females). (c) Average g/kg daily alcohol intake (line graph, with shaded SEMs) and total g/kg alcohol intake (bar graph inset) did not differ with sex (p > 0.05). (d) Three-dimensional model of a rat brain (adapted from [23], and edited using the Sketchup 3D modeling computer program (Trimble Inc., Sunnyvale, CA, USA)) showing the location of the sections taken for analyses in both experiments (2.2 mm anterior to Bregma). The large red box outlining the Cg1 represents the location in which samples were taken for Experiment 1 (myelinated fiber density, layers II-V, (e), while the smaller red box represents the location from which images were taken for Experiment 2 (nodal measurements, layer II/III, (f). Abbreviations: Cg1, anterior cingulate cortex, PrL, prelimbic cortex, IL, infralimbic, SEMs, standard errors of the mean.

