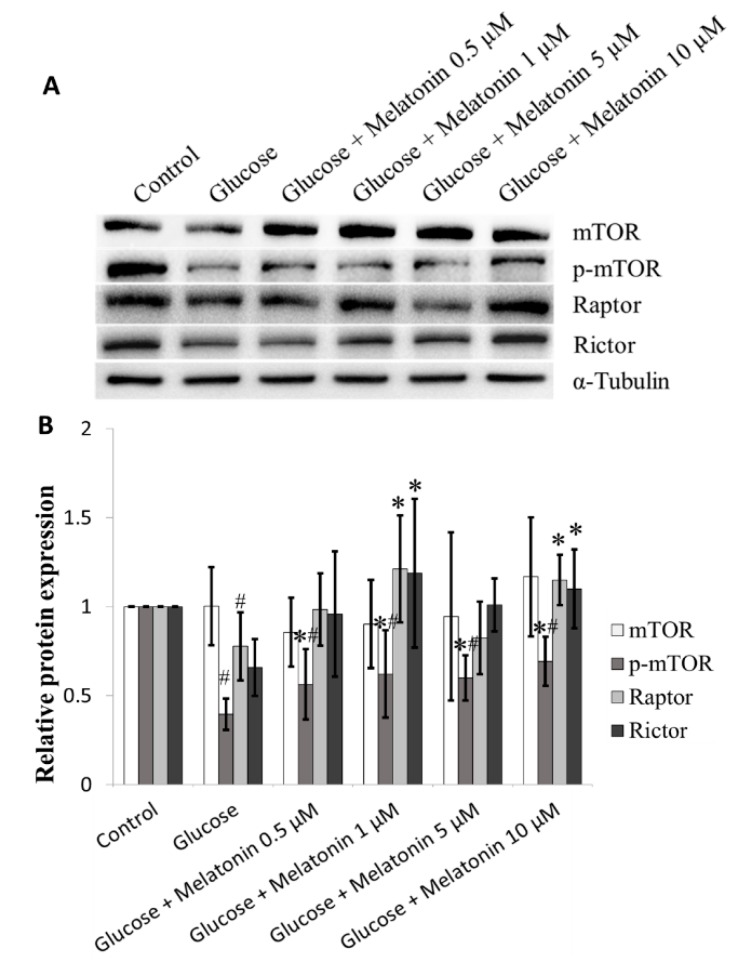
Figure 7.
Effects of melatonin on mTOR family proteins expression in high glucose-treated Schwann cells. The Schwann cells were treated with 100 mM of glucose with or without melatonin (0.5, 1, 5 and 10 μM) for 24 h. (A) represents mTOR family proteins expression was measured by Western blot. Tubulin was used as the housekeeping protein. (B) is a bar chart of proteins expression; each bar represents mean ± SD of three independent experiments. * p < 0.05 significant different vs. 100 mM glucose; # p < 0.05 vs. control.

