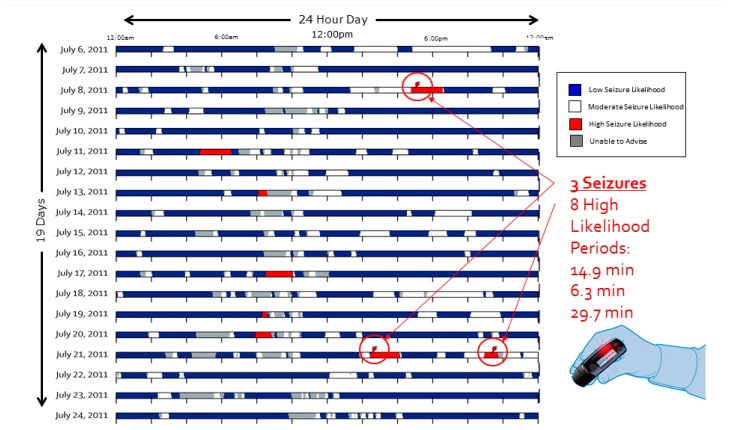
Figure 7.
Advisory Timeline over 19 day contiguous block. Each of the 19 horizontal rows represents a continuous 24 h period. Each day-long row is a raster plot comprising columns of pixels, each column representing 2.3 min duration and comprising a vertical series of pixels, each pixel representing 13.8 s. In the Advisory Timeline block, the patient had three seizures, each of which occurred within a “High Likelihood” (red indicator) advisory, of which there were eight in this 19-day period. In chronological order, the seizure advisory advance warning times were 14.9, 6.3, and 29.7 min.

