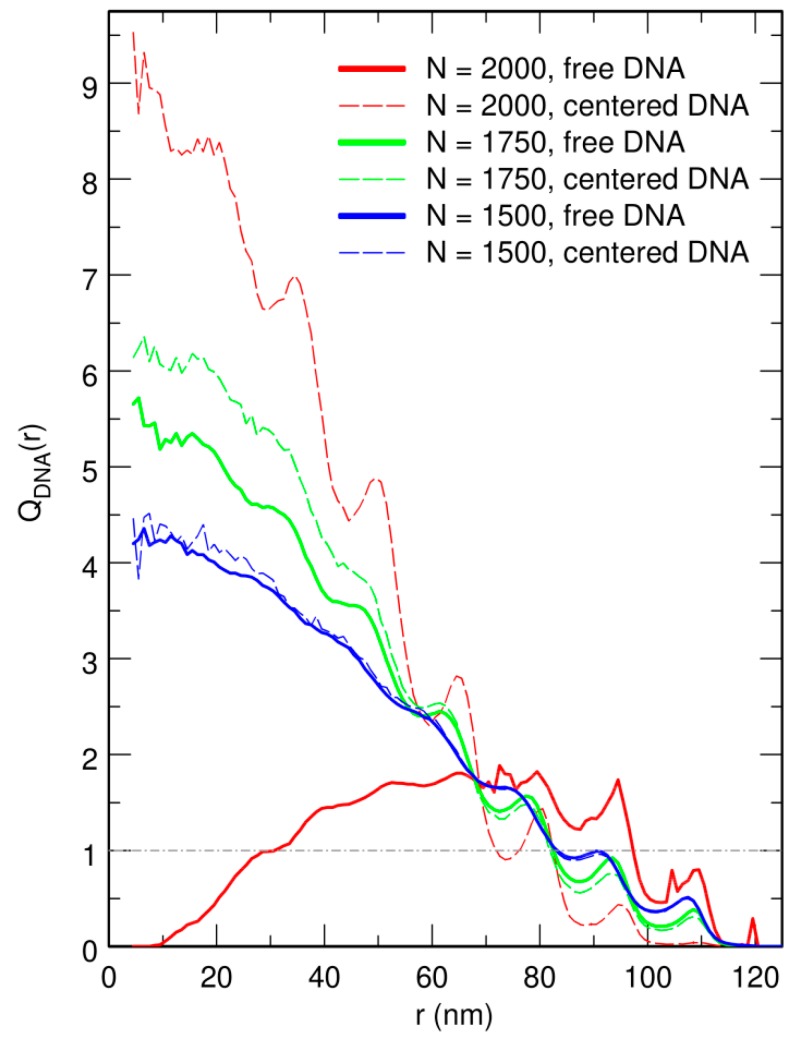
Figure 4.
Plot of , the enrichment in DNA beads as a function of the distance r from the center of the confinement sphere, for (blue curves), 1750 (green curves), and 2000 (red curves) crowders. Dashed lines correspond to the case where the center of the confinement sphere was repositioned on top of the center of mass of the DNA chain after each integration time step, and solid lines to the case where the centering step was omitted. is constant and equal to 1 (dot-dashed horizontal gray line) for DNA beads distributed homogeneously all over the confinement sphere. r is expressed in units of nm. , 1750, and 2000 correspond to effective volume fractions of the crowders , 0.58, and 0.66, respectively.

