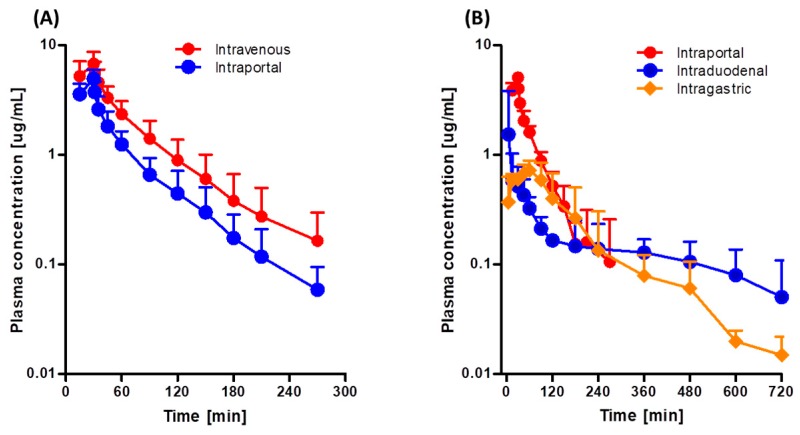
Figure 3.
Mean arterial plasma concentration-time profiles of tofacitinib in Sprague-Dawley rats after (A) 30-min intravenous (n = 7) and intraportal (n = 7) infusions of 10 mg/kg tofacitinib and (B) 30-min intraportal (n = 6) infusion, and intraduodenal (n = 5) and intragastric (n = 5) instillations of 10 mg/kg tofacitinib. Bars represent standard deviations (SD).

