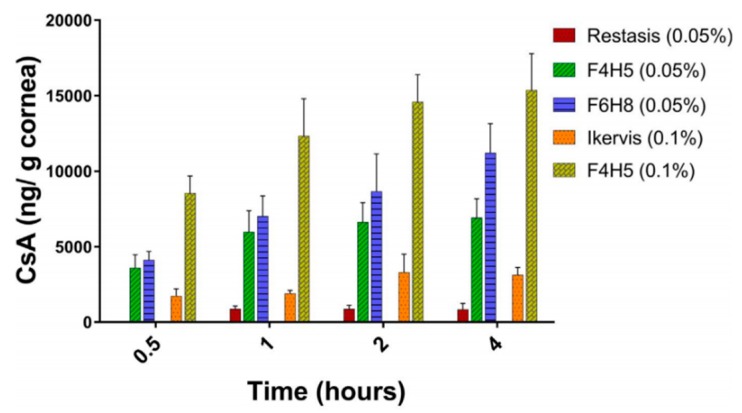
Figure 19.
Corneal penetration of cyclosporin A (CsA) from the test formulations. The amount of CsA recovered (ng) per g of cornea after application of a single 50-µL dose was plotted against time (n = 5; mean ± standard error of the mean (SEM)). Reproduced from Reference [142] with permission from Elsevier, 2018.

