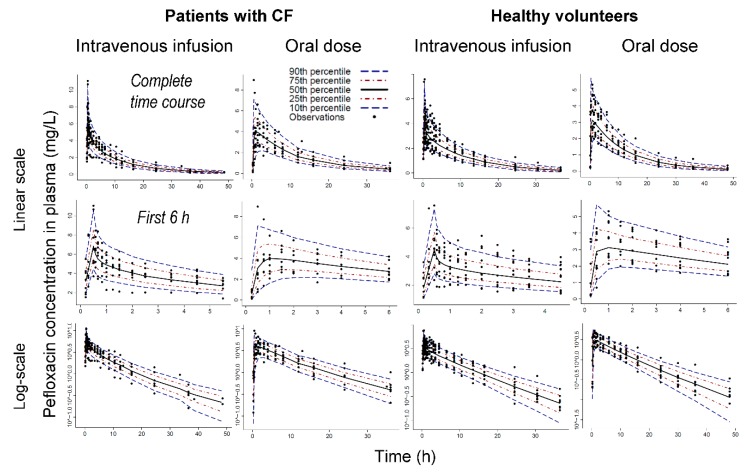
Figure 3.
Visual predictive check for pefloxacin plasma concentrations in patients with CF (left) and healthy volunteers (right). The two top rows show plasma concentrations over the complete time course (first row) or during the first 6 h (second row), whereas the third row displays concentrations on logarithmic scale. The plots show the observations (markers), the 50th percentile (i.e., median) of the model predictions (black line) along with the 80% prediction interval [10th to 90th percentile] and the interquartile range [25th to 75th percentile]. Ideally, the median should capture the central tendency of the observations and 10% of the observations should fall outside the 80% prediction interval on either side.

