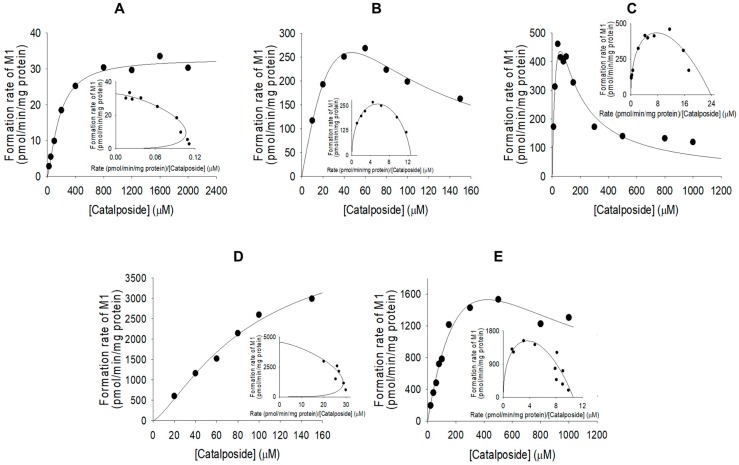
Figure 5.
Michaelis–Menten plots of the sulfation of catalposide to catalposide sulfate (M1) by pooled human liver S9 fractions (A) and human cDNA-expressed SULT1A1*1 (B), SULT1A1*2 (C), SULT1C4 (D), and SULT1E1 (E). Insets: Eadie–Hofstee plots. Each data point represents the average of two determinations.

