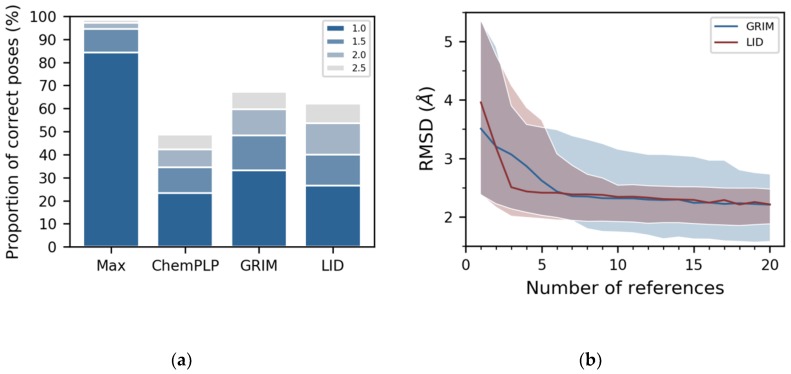
Figure 3.
LID’s performance in pose prediction. (a) comparison with GRIM and ChemPLP. The legend indicates the threshold in Å under which poses are considered as correct. “Max” represents the proportion of correct poses according to the best possible RMSD criterion; (b) as a function of the number of reference 3D structures used to build the map. The distributions of median RMSDs obtained for the 19 proteins in the dataset using LID and GRIM are shown in red and blue, respectively. A line is drawn at the median value calculated on the 19 proteins, and the colored area delimits the first and ninth deciles of the distribution.

