
Figure 2.
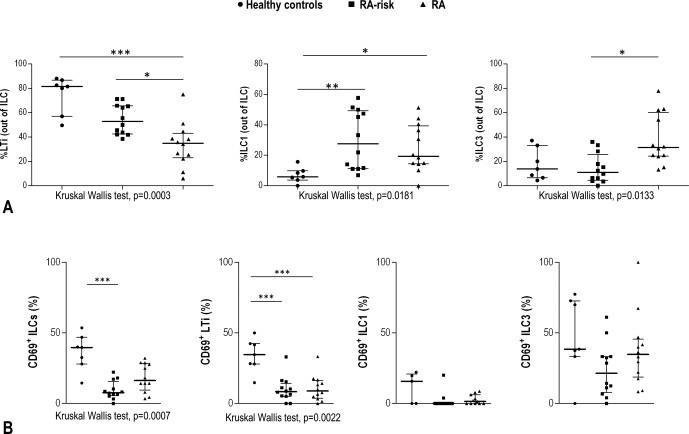
Analysis of innate lymphoid cell (ILC) subsets in lymph node biopsy specimens from healthy controls, individuals at risk of rheumatoid arthritis (RA), and patients with RA. A, Percentages of lymphoid tissue–inducer (LTi) cells, ILC1, and ILC3 among total ILCs. B, Frequency of CD69 in total ILCs and in ILC subsets. Symbols represent individual samples; horizontal lines and error bars show the median and interquartile range. Differences between the 3 groups were assessed by Kruskal‐Wallis test (P values shown at the bottom of each panel); Dunn's post hoc test was then used to compare differences between 2 groups. ∗ = P < 0.050; ∗∗ = P < 0.010; ∗∗∗ = P < 0.001.