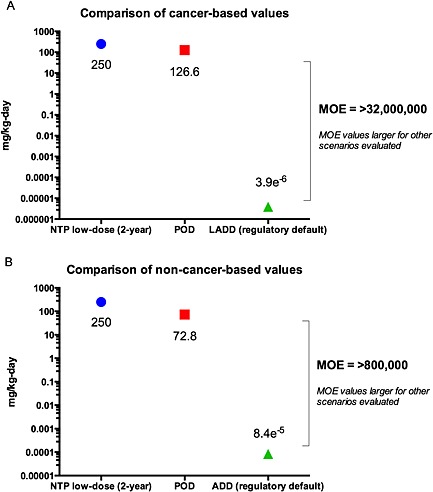
Figure 2.

Comparison of cancer (A) and non‐cancer (B) toxicity values to the associated POD and to the lowest dose tested in the National Toxicology Program (NTP) 2‐year study. Note: exposure estimates shown are based on most conservative exposure scenario (regulatory default).
