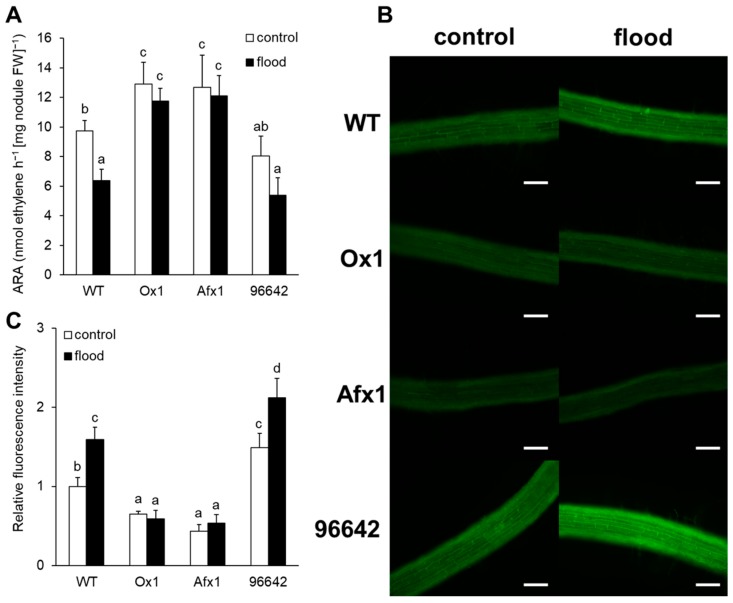
Figure 1.
Nitrogenase activity and NO production in roots of the WT, Ox1, Afx1, and 96642 lines. (A) Nitrogenase activity (estimated as ARA) was measured in the flooded and unflooded (control) nodules and was expressed as ethylene produced per hour and mg nodule fresh weight. (B) Fluorescence imaging of NO production in roots with the DAF-FM DA probe. Scale bars, 100 µm. (C) Quantification of fluorescence intensity in DAF-FM DA images. In A and C, values are means ± SE of nine biological replicates. Means denoted by the same letter do not differ significantly by Student’s t-test at p < 0.05.

