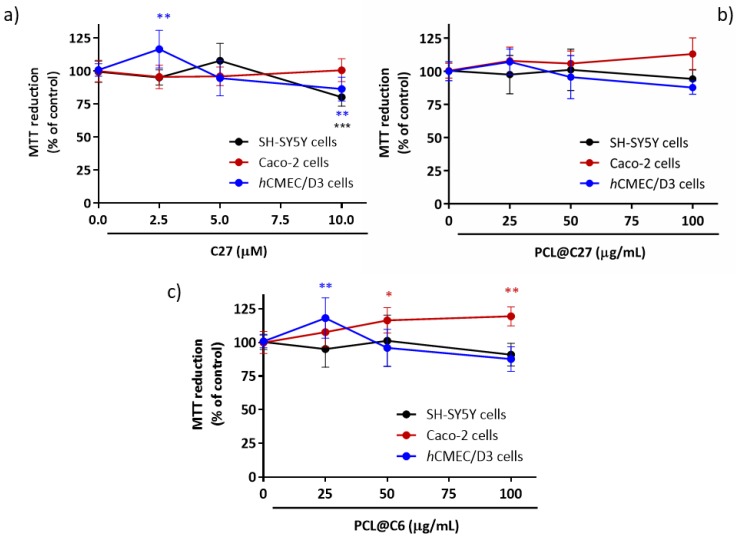
Figure 6.
Cytotoxicity profile of C27 at 2.5, 5, and 10 µM (a) as well as nanoformulations of PCL@C27 (b) and PCL@C6 NPs (c) at 25, 50, and 100 µg/mL in different cells lines, evaluated by the MTT reduction assay 24 h after exposure. Results are expressed as mean percentage of MTT reduction ± SD of three independent experiments. In all cases, p-values lower than 0.05 were considered significant (* p < 0.05, ** p < 0.01, *** p < 0.001 versus control cells).

