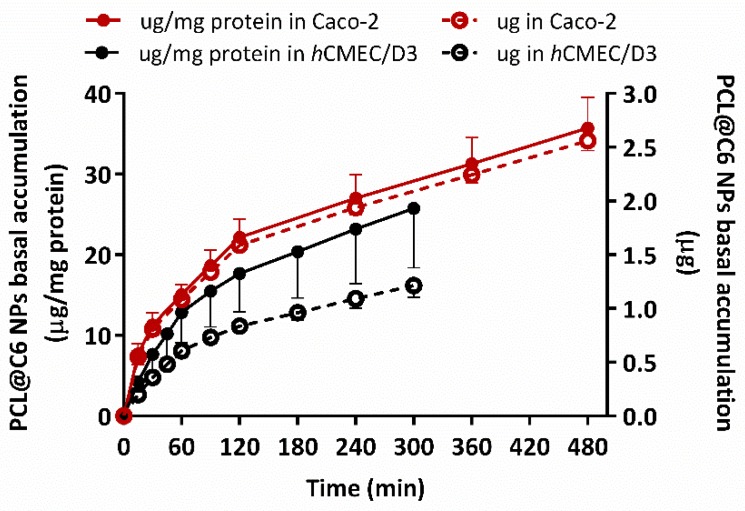
Figure 8.
Amount of PCL@C6 NPs, with (µg/mg of protein, solid circles and line) or without (µg, empty circles points and dash line) protein mass normalization, accumulated in basal medium after 5 h and 8 h of permeability experiment in hCMEC/D3 (black data) and Caco-2 (red data) cells with a 100 µg/mL initial concentration. Results are expressed as mean ± SD of three independent experiments.

