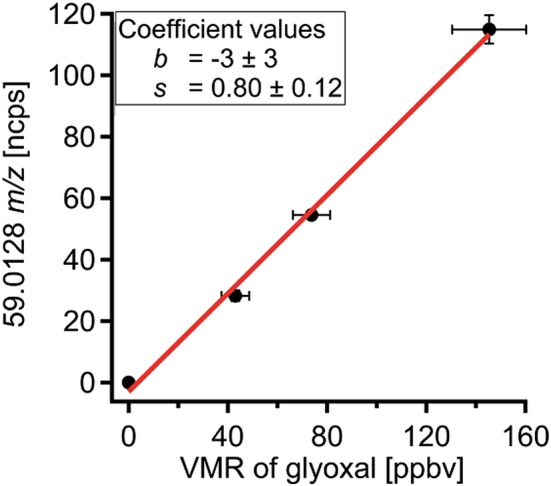
Figure 3.

Calibration curve of glyoxal with a dry dilution flow at a m39/m21 ratio of 0.02. The horizontal error bars represent the uncertainty in the concentration of glyoxal and the accuracy of the dilution factor. The vertical error bars stem from the standard deviation of the measured signal.
