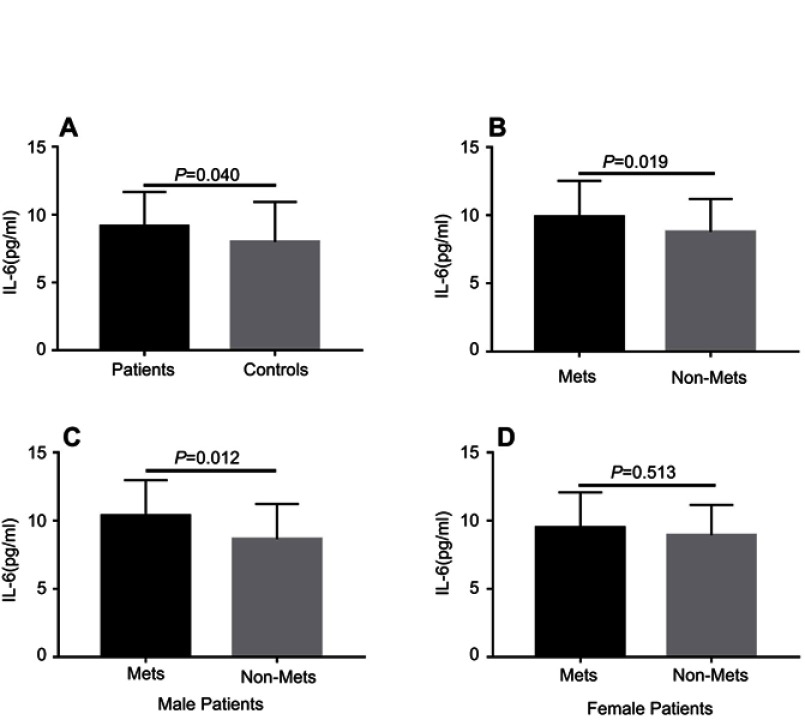
Figure 1.
Comparison of plasma IL-6 levels between different groups. Each bar represents the mean level of IL-6. Error bars represent the standard deviation. (A) Plasma level of IL-6 in schizophrenia patients and healthy controls (9.14±2.52 vs 7.98±2.96 pg/mL, F=4.303, P=0.040); (B) Plasma level of IL-6 in MetS and non-MetS groups (9.90±2.62 vs 8.78±2.40 pg/mL, F=5.609, P=0.019); (C) Plasma levels of IL-6 in male MetS patients and non-MetS patients (10.35±2.63 vs 8.66±2.57 pg/mL, F=6.709, P=0.012); (D) Plasma levels of IL-6 in female MetS patients and non-MetS patients (9.48±2.60 vs 8.93±2.23 pg/mL, F =0.403, P=0.513). The P-values for intergroup comparison of IL-6 were adjusted for age, sex, years of education, BMI, age of onset, total disease course, and equal dose of olanzapine were controlled as covariates.
Abbreviations: BMI, body mass index; IL-6, interleukin 6; MetS, metabolic syndrome.

