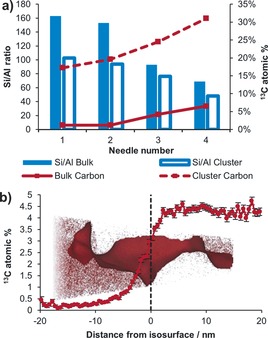
Figure 2.

a) Bulk and cluster Si/Al ratio and 13C atomic % plotted for APT needles 1 to 4 (see the Supporting Information for a discussion of the quantification of the Si/Al ratio). Clusters are defined as groups of closely spaced 13C atoms and the cluster Si/Al ratio is inside the volume occupied by the clusters, averaged over all clusters in each needle. b) Compositional histogram across the 13C isosurface in needle 3 (3 % boundary; only a selected portion of needle 3 is shown).
