Figure 3.

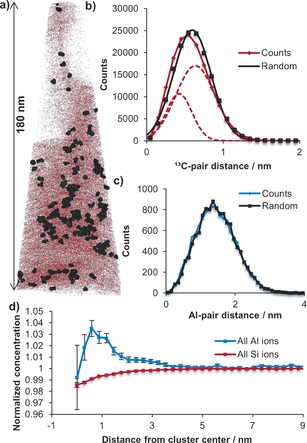
a) Map of 13C clusters identified in APT needle 3 superimposed over all 13C ions. The large black dots represent the 13C cluster atoms and the smaller red dots represent all 13C ions. b) NNDs for 13C in needle 3 along with Gaussian fits of the data. The measured data is plotted in red and randomized data in black. The 13C solute distribution is best described by two Gaussians (dashed lines), indicating the presence of a population of clusters with smaller NNDs than those found for the remaining atoms or the randomized data. c) NNDs for Al in needle 3 showing an unimodal distribution, that is, the absence of any Al clusters. d) Radial distribution function for needle 3, which describes the normalized radial concentration of Al and Si relative to the bulk starting at the center of the 13C cluster. The short‐distance error bars are large because of the low number of ions measured close to the center of the cluster.
